Exercise Set 2 Answers
These exercises cover the topics of Functions and Graphs.
Sketch the graphs of the following functions on the interval \(-2\le x \le 2\).
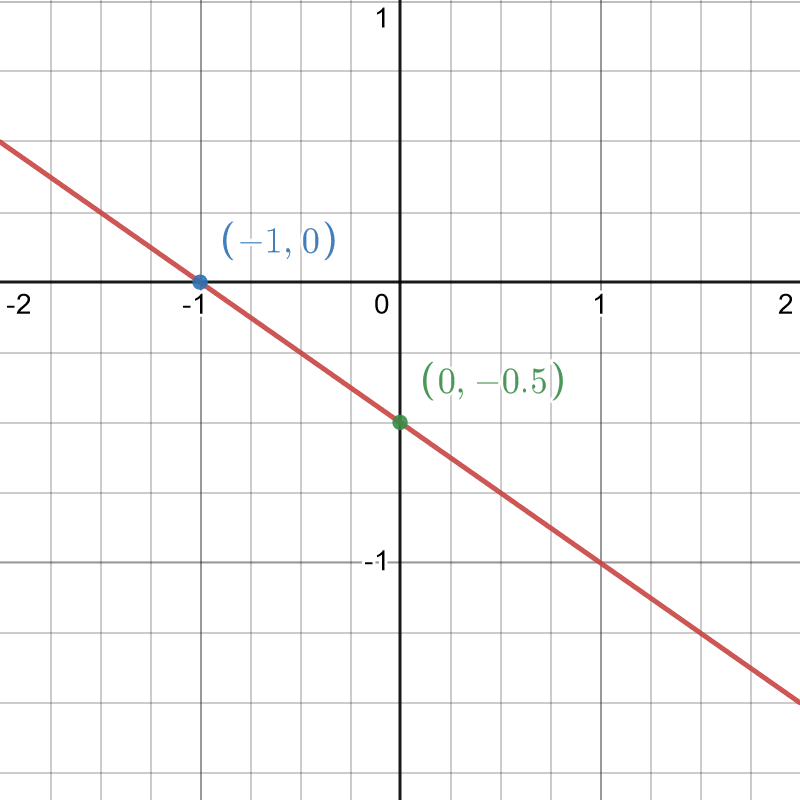
- \(y=-\frac{1}{2}(x+1)\)
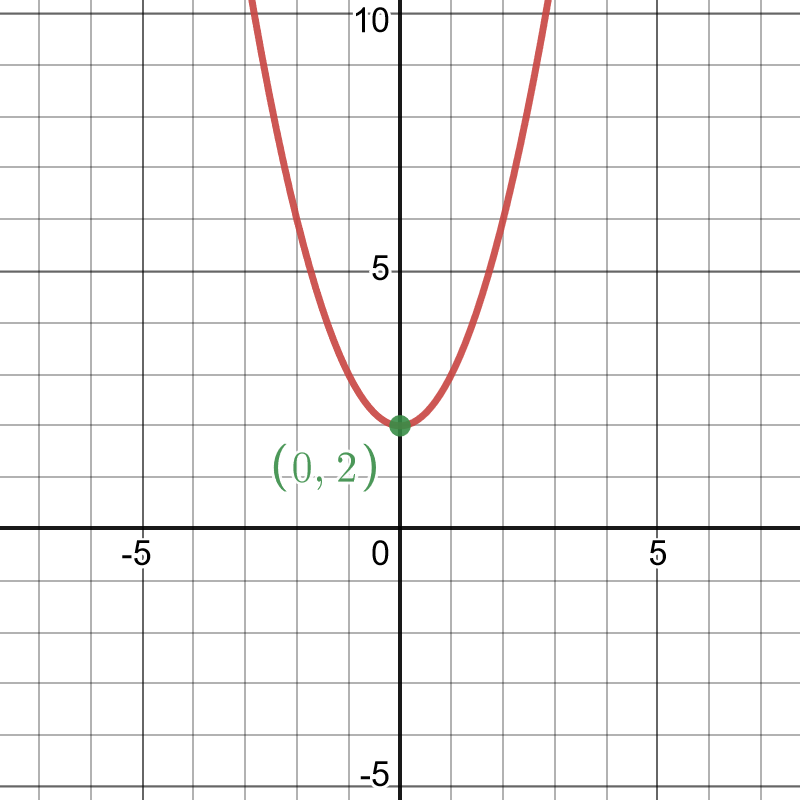
- \(y=x^2+2\)
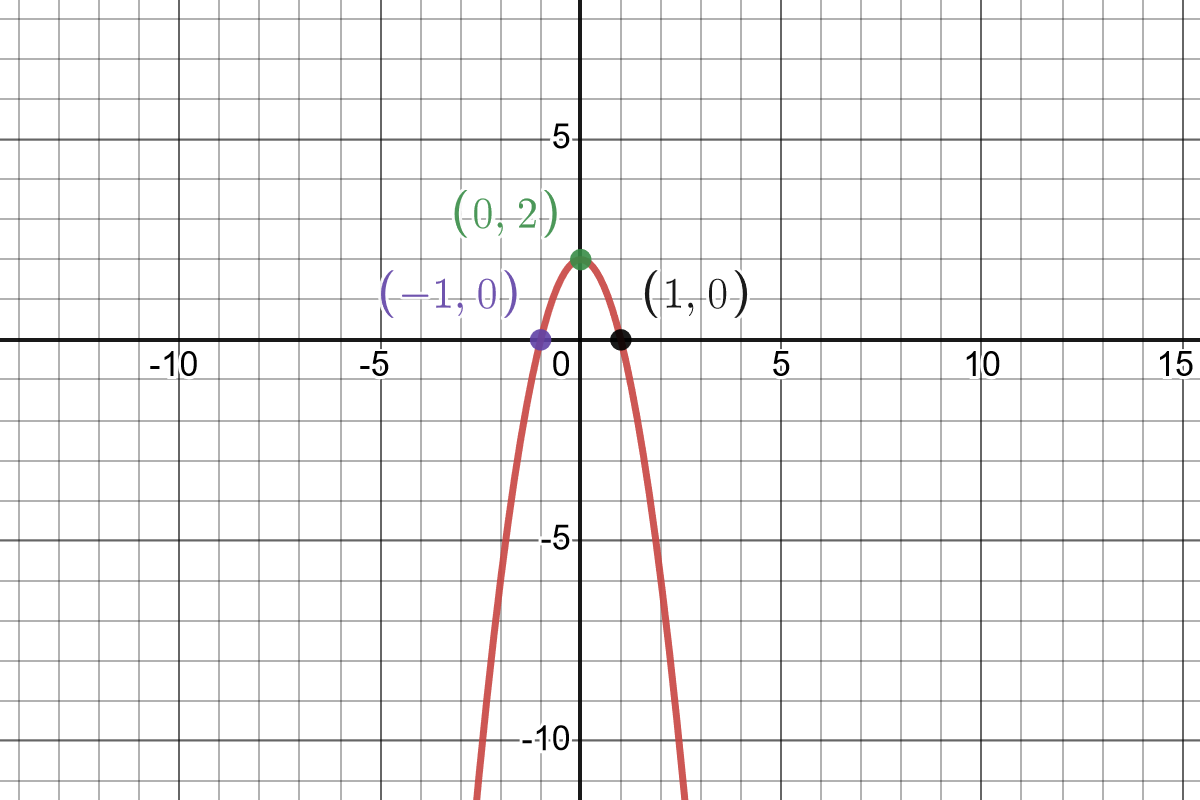
- \(y=-2x^2+2\)
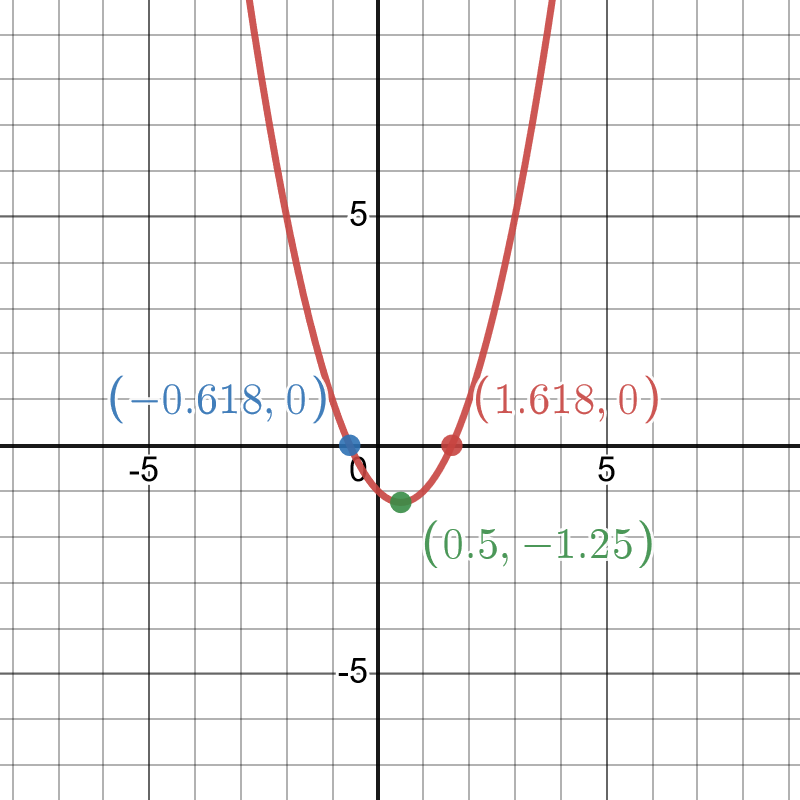
- \(y=x^2-x-1\)
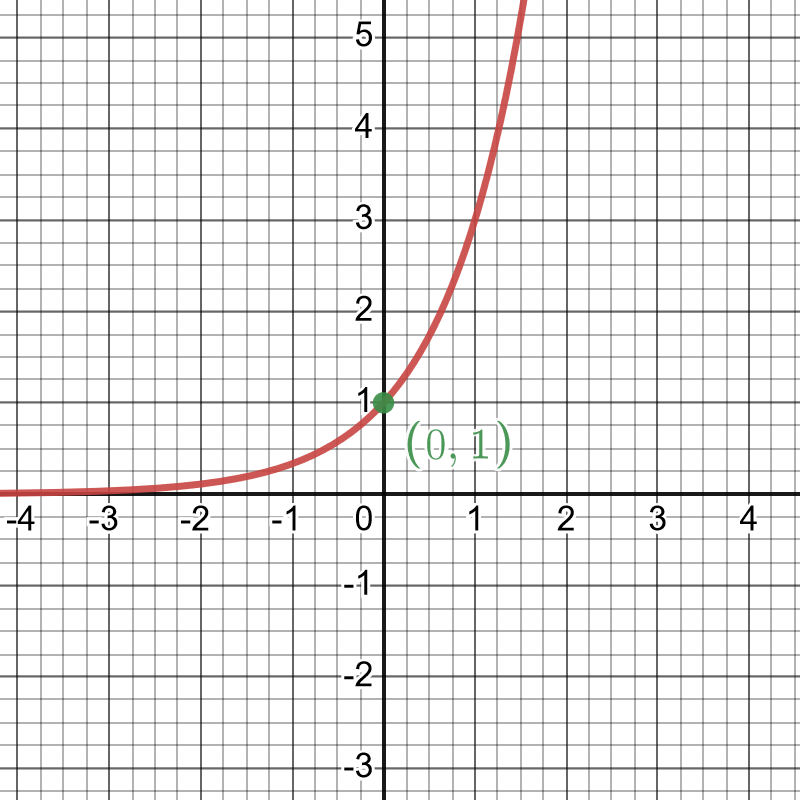
- \(y=3^x\)
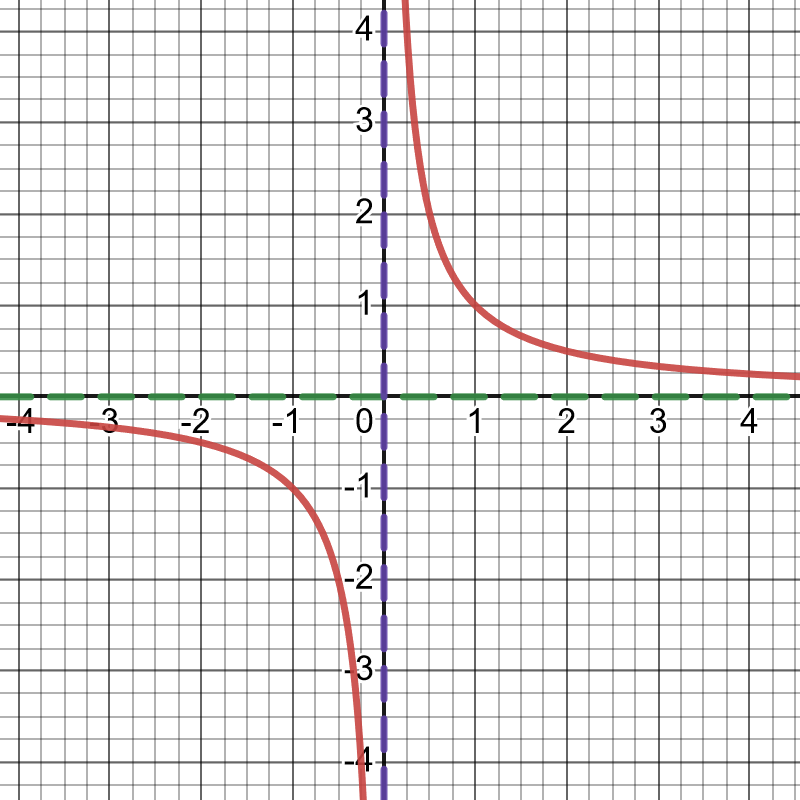
- \(y=\frac{1}{x}\)
Tips: find where the functions cross the axes; use completing the square to find the maximum or minimum of quadratics; identify any asymptotes.
Answers:
Expanding: \(y=-\frac{1}{2}x-\frac{1}{2}\) which we recognise as a line with gradient \(-\frac{1}{2}\) and y intercept \(-\frac{1}{2}\). Solving for \(y=0\) gives the x intercept as \((-1,0)\).
This is a parabola shifted up by 2 units.
This is an “upside down” parabola, shifted up by two units.
Completing the square \(y=(x-\frac{1}{2})^2-\frac{5}{4}\). Since the squared term is always non-negative, it is smallest when it is zero at \(x=\frac{1}{2}\). This is the position of the minimum, and at this point \(y=-\frac{5}{4}\). Factorising: \((x-\frac{1+\sqrt{5}}{2})(x-\frac{1-\sqrt{5}}{2})\), so the curve crosses the x axis at \(x=\frac{1+\sqrt{5}}{2}\) and \(x=\frac{1-\sqrt{5}}{2}\). Since the coefficient of \(x^2\) is positive, the parabola opens upwards.
This is an exponential \(a^x\) with \(a>1\). All exponential functions cross the y axis at \(a^0=1\) and the do not cross the \(x\) axis.
This is a rational function with a vertical asymptote at \(x=0\). It is small and positive for large positive values of \(x\) and it is small and negative for large negative values of \(x\): the line \(y=0\) is a horizontal asymptote.
Sketch the following graphs (with \(x\) in radians):
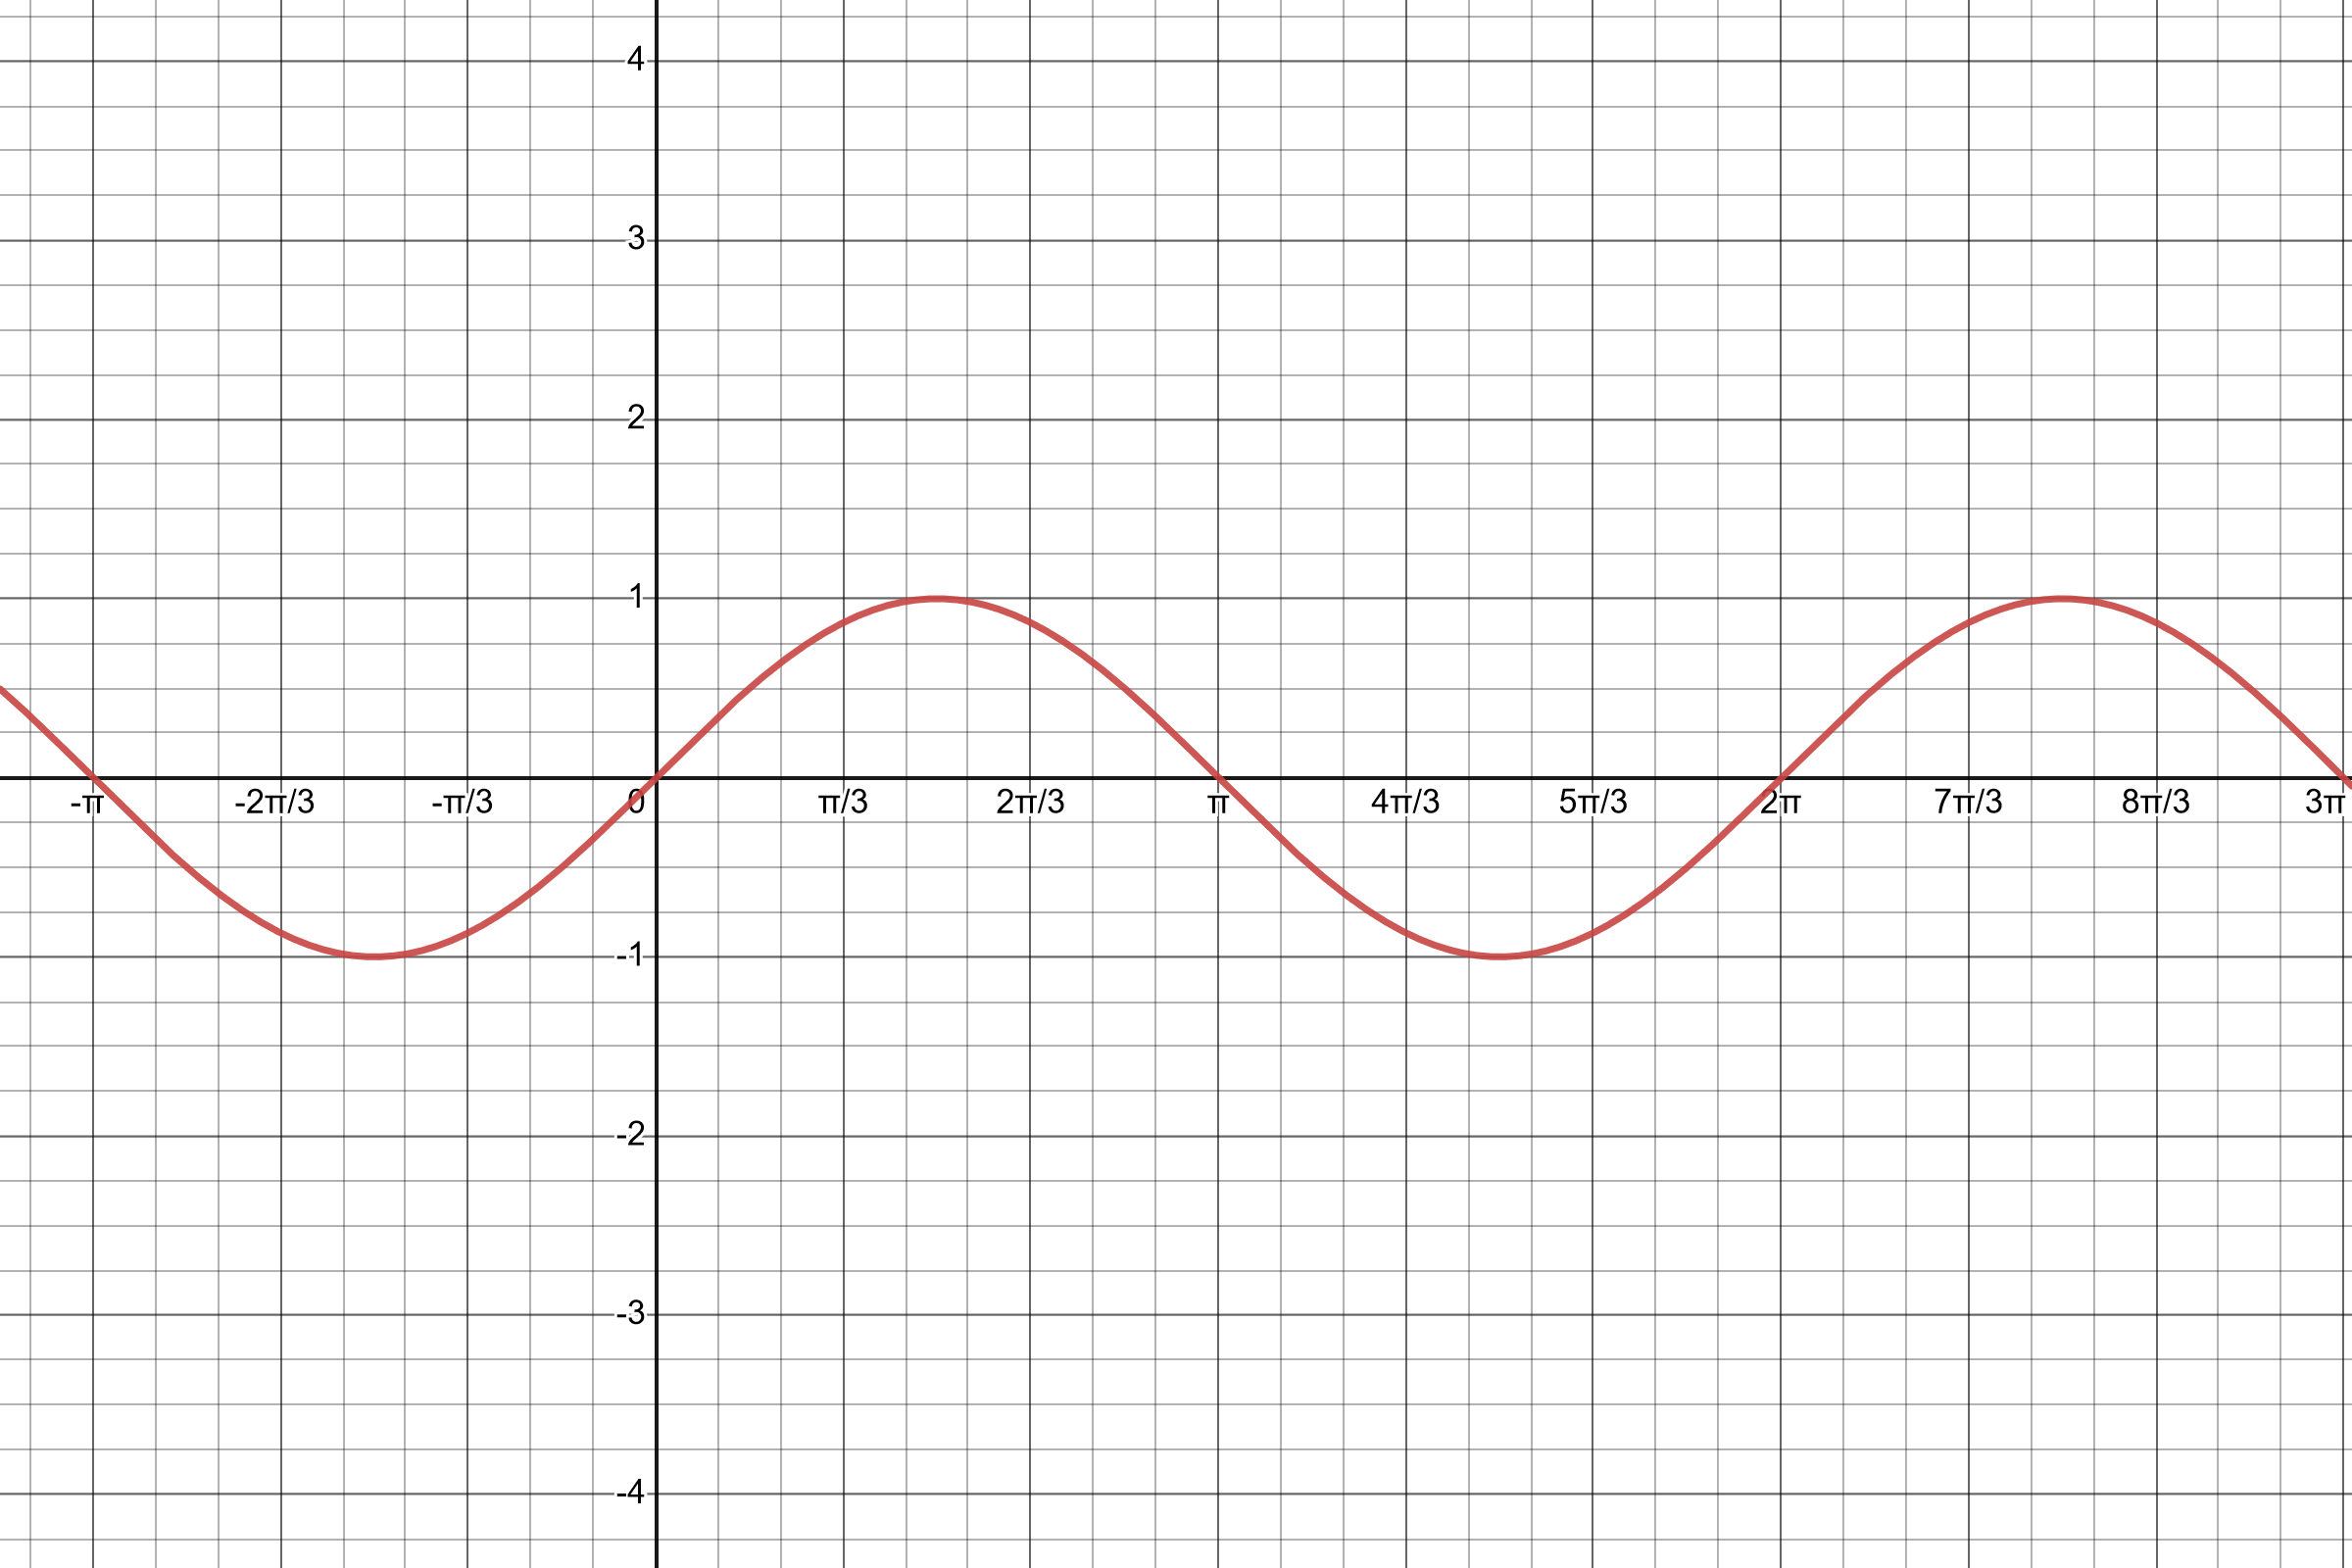
- \(y=\sin(x)\)
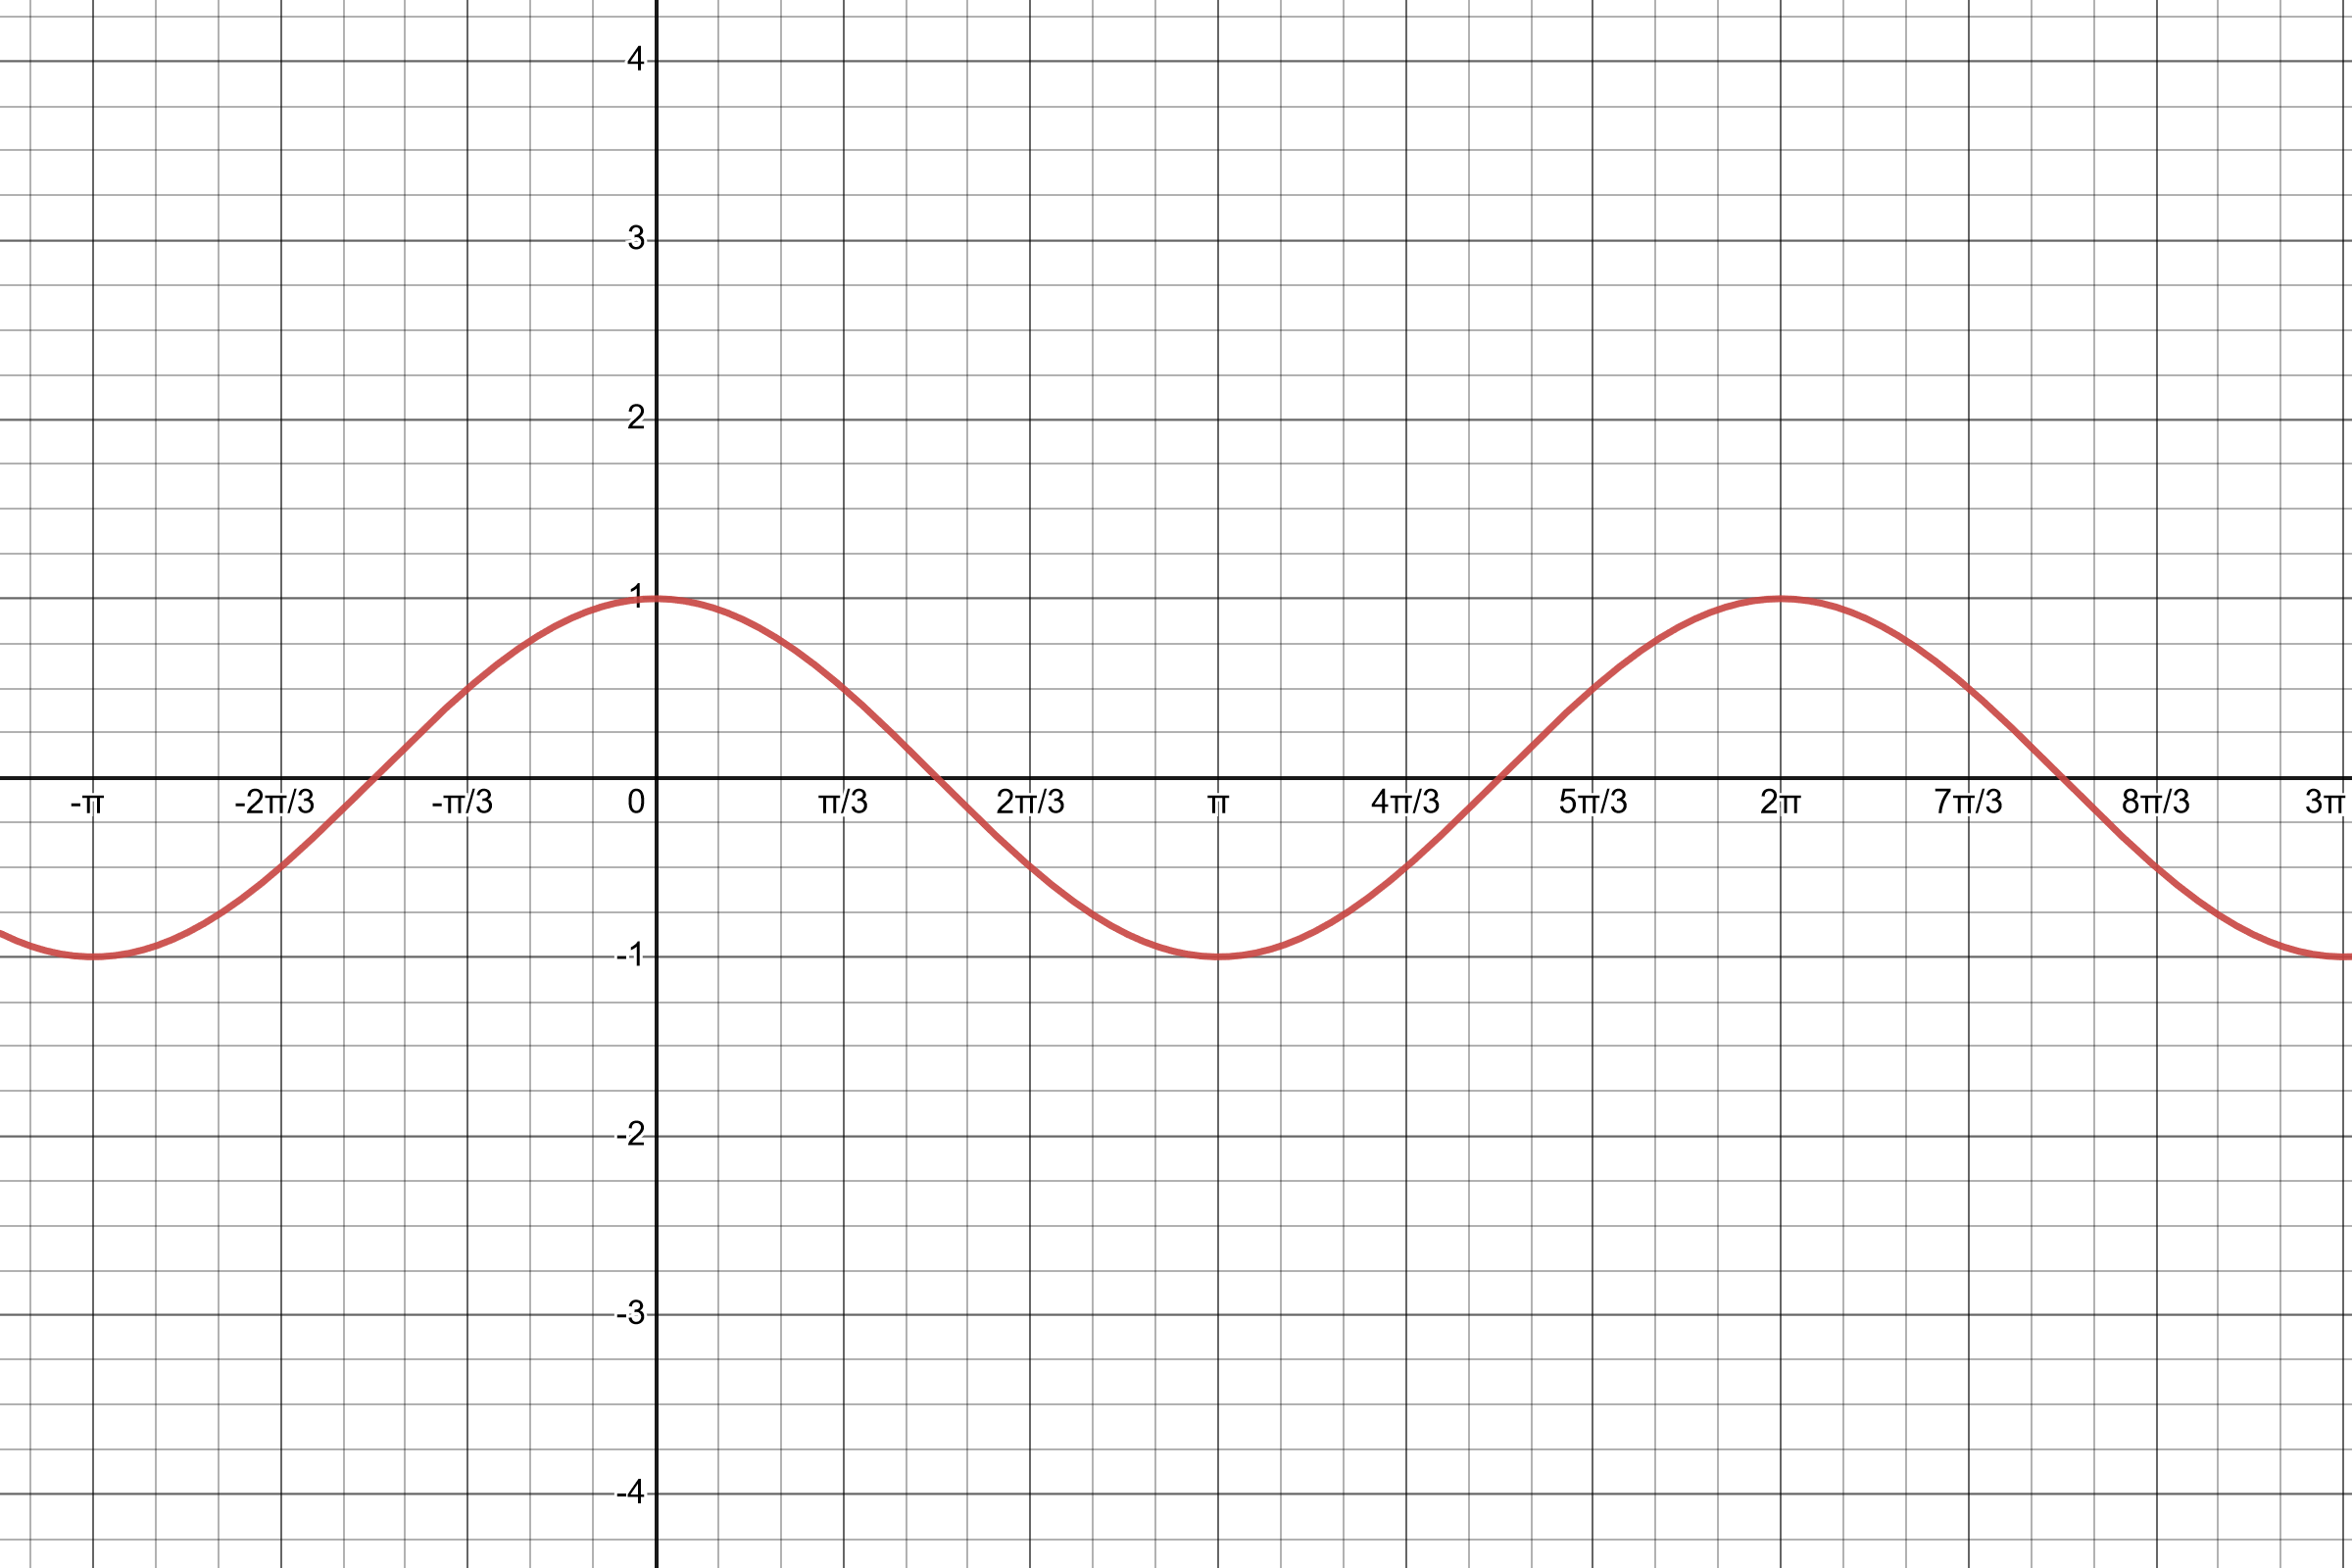
- \(y=\sin(x+\frac{\pi}{2})\) (does this look familiar?)
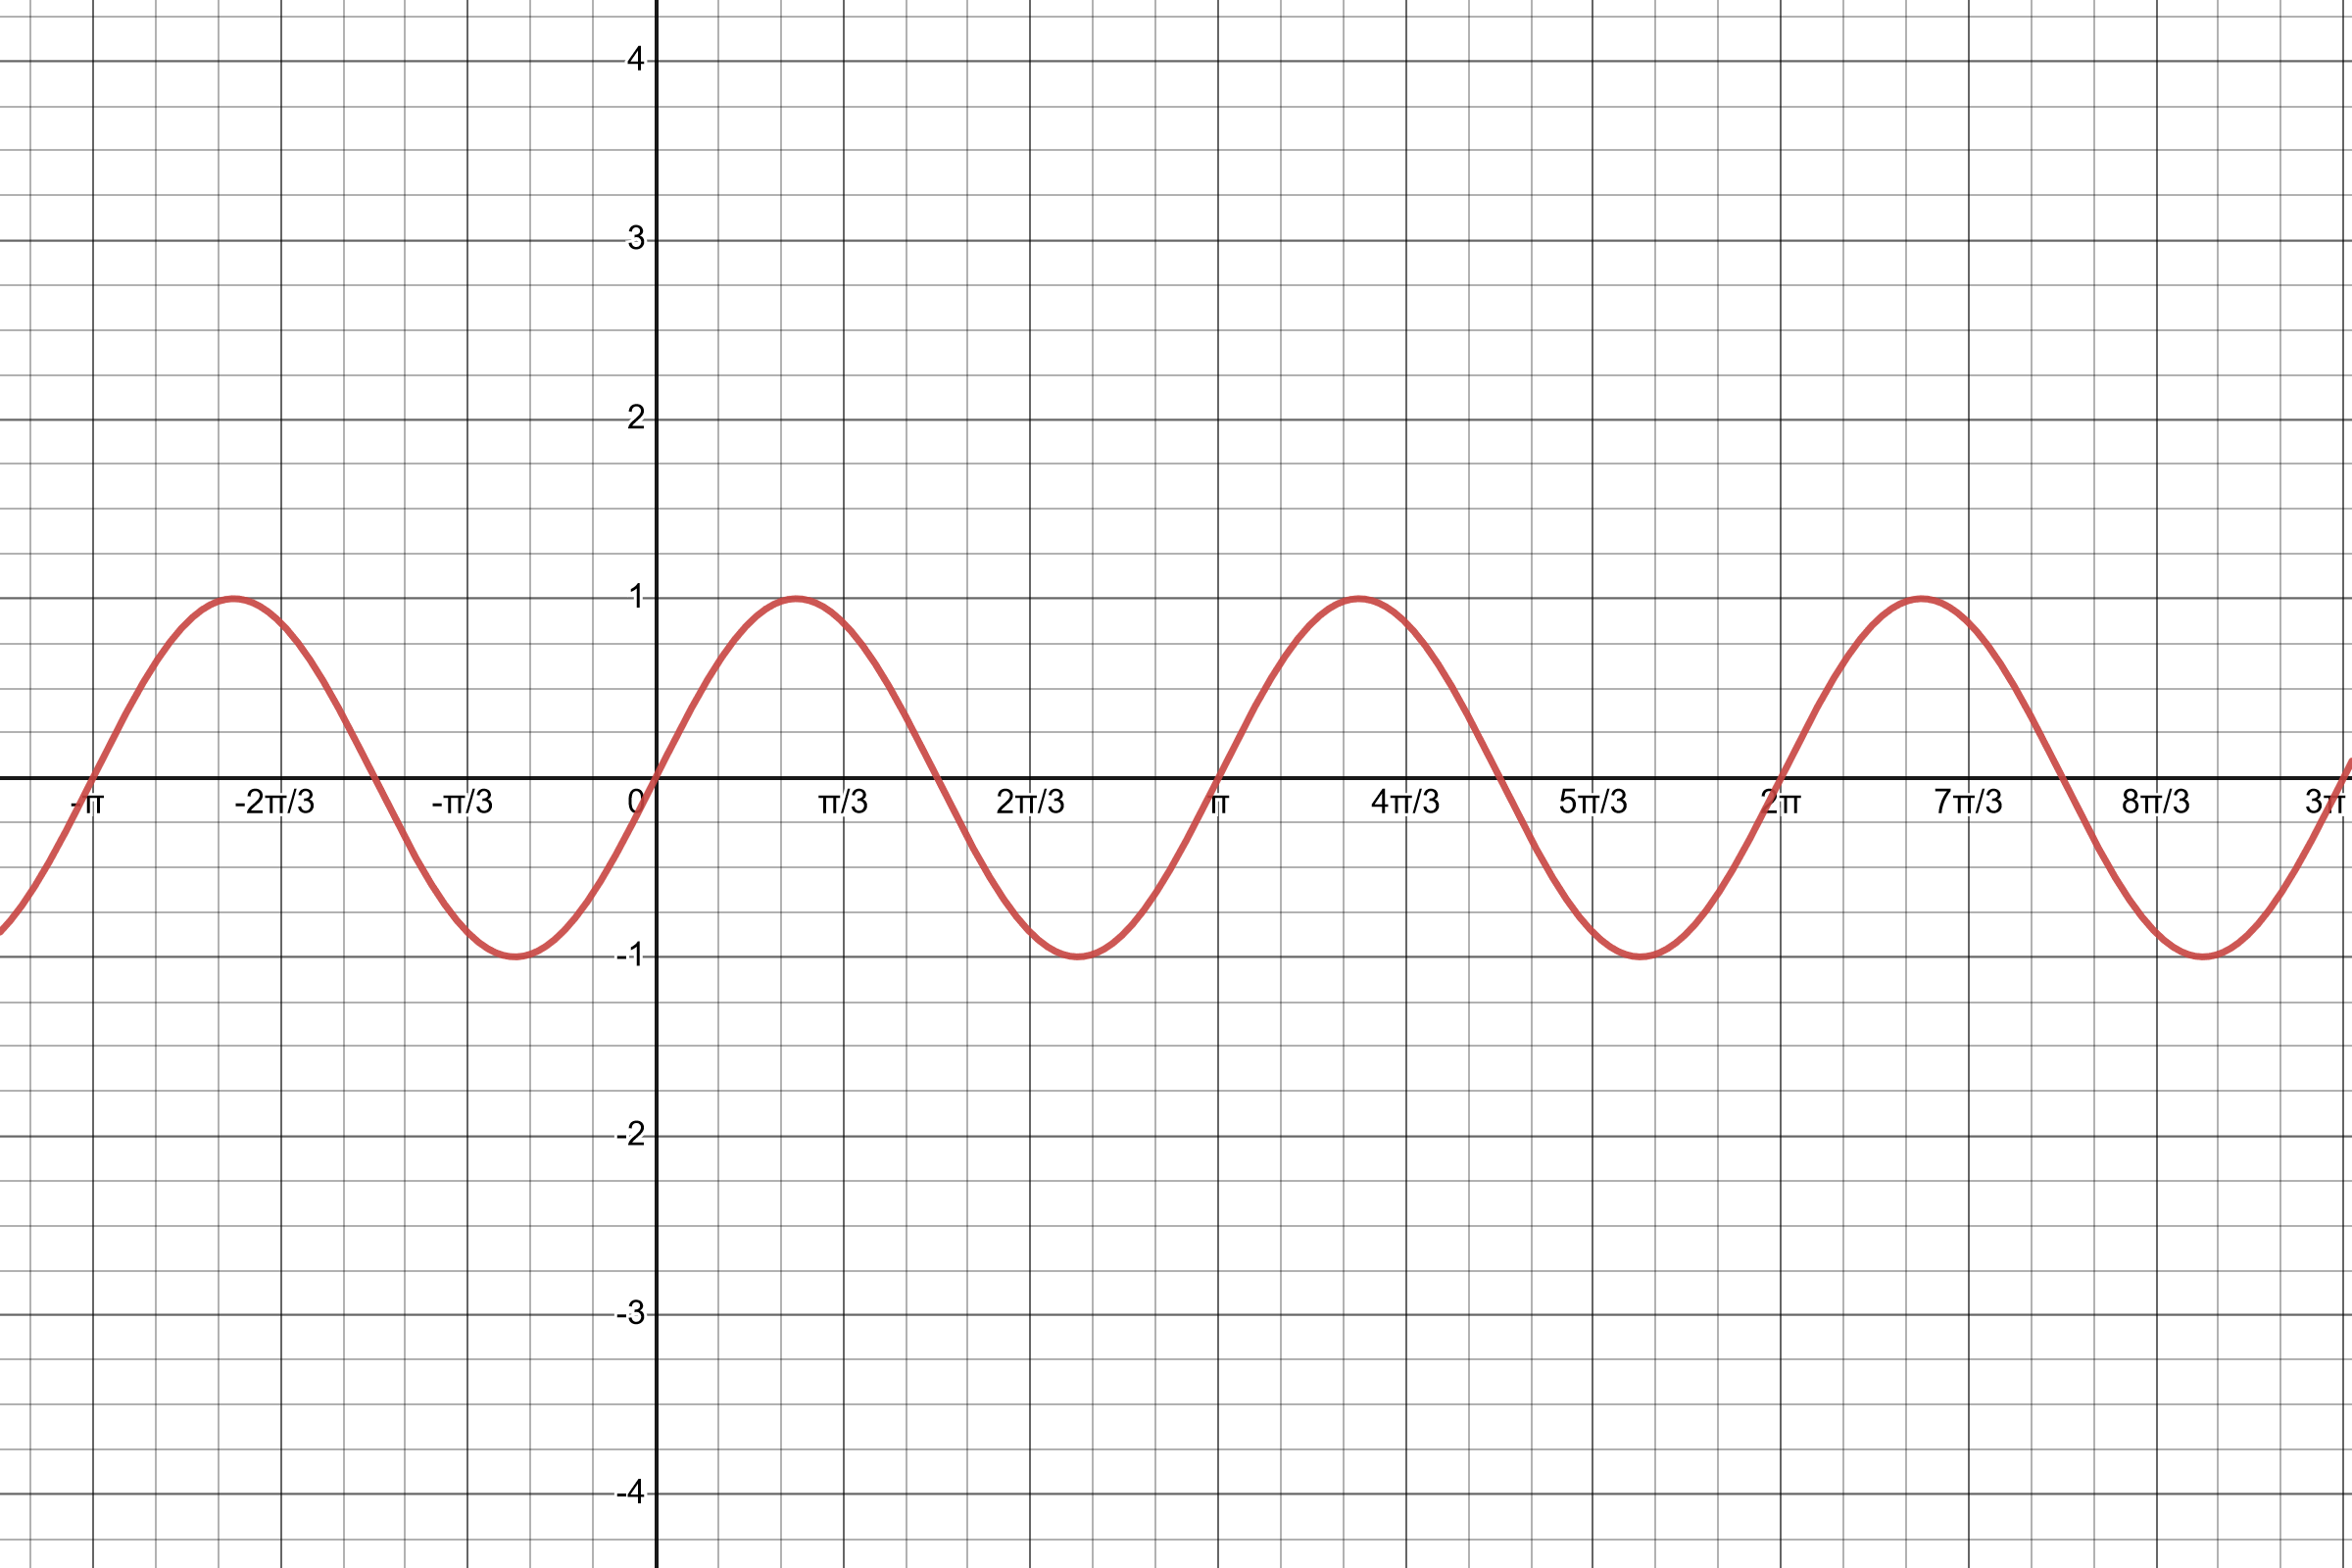
- \(y=\sin(2x)\)
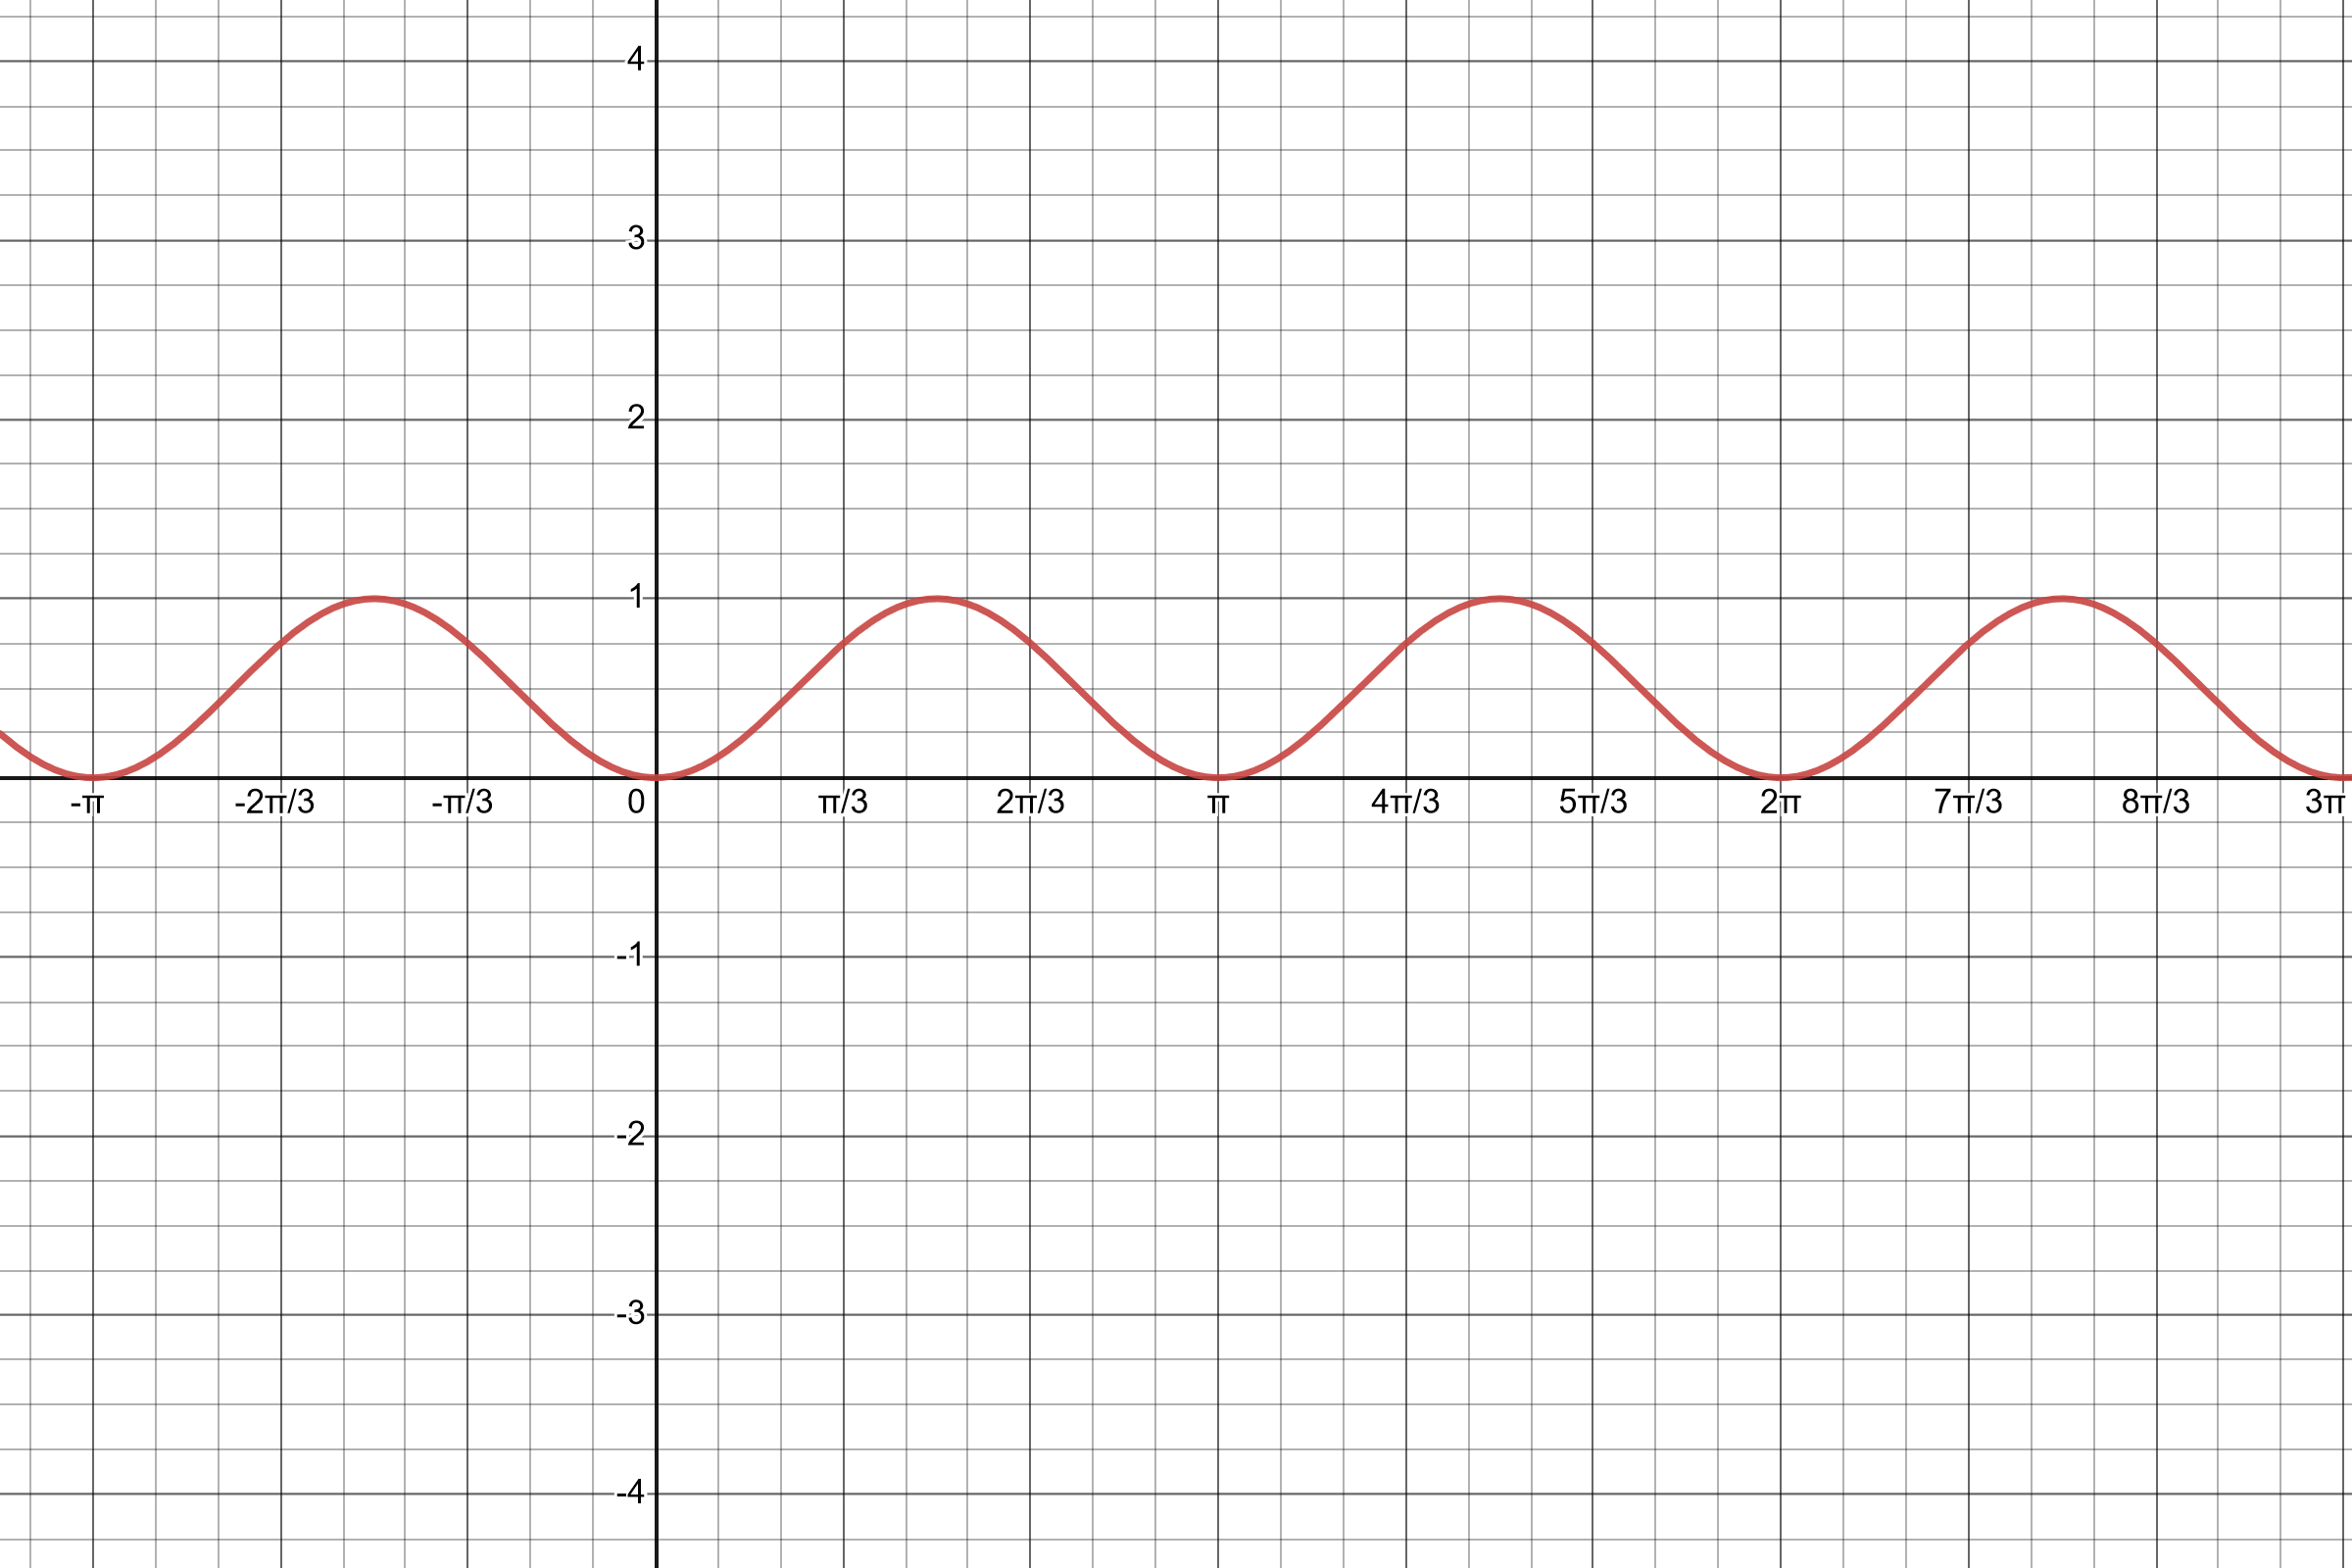
- \(y=\sin^2(x)\)
Answers:
You should be familiar with this graph and the location of maxima, minima and axis intercepts.
Note that \(\sin(x+\frac{\pi}{2})=\cos(x)\).
This is double the angular frequency of the usual sine function.
Note that all the y values are non-negative.
If we had the graph of a function \(f(x)\), describe what would change qualitatively for the graph of \(f(a\times x)\) where \(a\) is a constant. Consider the cases:
- \(a>1\)
- \(0 < a < 1\)
- \(-1 < a < 0\)
- \(a<-1\)
Answers:
- For \(a>1\), the graph is “squeezed” along the x axis, with the value at \(x=0\) remaining unchanged.
- For \(0 < a <1\), the graph is expanded along the x axis, again with the value at \(x=0\) unchanged.
- For \(-1 < a <0\), the graph is again expanded, along the x axis, but the minus sign in \(a\) also means that the graph is reflected in the y axis.
- For \(a<-1\), the graph is squeezed horizontally and reflected in the y axis.
If we had the graph of a function \(f(x)\), describe what would change qualitatively for the graph of \(f(x+b)\) where \(b\) is a constant. Consider the cases:
- \(b>0\)
- \(b<0\)
Answers:
- For \(b>0\), the \(f(x+b)\) is the graph of \(f(x)\) translated to the left by distance \(b\)
- For \(b<0\), the whole graph is translated to the right by distance \(b\)
If we had the graph of a function \(f(x)\), describe what would change qualitatively for the graph of \(f(x)+c\) where \(c\) is a constant. Consider the cases:
- \(c>0\)
- \(c<0\)
Answers:
- For \(c>0\), \(f(x)+c\) is the graph of \(f(x)\) shifted vertically up along the y axis
- For \(c<0\), \(f(x)+c\) is the graph of \(f(x)\) shifted vertically down along the y axis